Key points
Per-person water consumption should be interpreted differently depending on the scope considered: mains drinking water, household use or water footprint. Averages provide a useful reference point, but habits and equipment explain many of the differences.
- In France, a commonly used reference figure is around 150 litres of drinking water per person per day.
- Figures are only comparable if their scope, unit and year are specified.
- Hygiene and cleaning account for most of the water used at home.
- Household size, appliances, leaks and outdoor use all affect the results.
- Tracking your own use helps you choose practical measures rather than following advice at random.
What does water consumption per person measure?
The expression sounds straightforward, but it does not always mean the same thing from one source to another. It may refer to drinking water supplied, use recorded by a meter, or a broader estimate of the water used to produce goods and food. Before comparing two figures, you therefore need to know what is being counted and over what period.
Daily and annual consumption: which units can you compare?
Litres per day help you picture daily use, while cubic metres per year are often used on bills or in annual statistics. The conversion is straightforward: 1 m³ is equivalent to 1,000 litres. When comparing figures, you should also check whether they apply to one person or to an entire household.
As a guide, 150 litres per day is equivalent to around 54.8 m³ over a 365-day year. This conversion does not turn an average into an individual measurement: it simply gives you a rough indication. A source covering average consumption in France gives a similar reference figure, but the date and method should still be checked.
Household water, abstraction and water footprint: what is the difference?
Household water covers uses associated with the home, such as showers, toilets and laundry. Abstraction refers to water taken from the environment for various sectors, so it is not limited to households. A water footprint, meanwhile, includes water used upstream to manufacture or grow the things we consume.
These indicators are not interchangeable. Someone may use relatively little tap water while consuming products whose manufacture uses water resources elsewhere. For household use, meter readings are generally more directly informative than calculated footprints for a wide range of goods.
National average and individual consumption: why distinguish between them?
A national average divides a total volume across a population according to a given method. It does not precisely describe any one person’s household, because consumption varies with the home, household composition and habits. An average is not a personal target: it is a point of comparison that should be interpreted with care.
You should also check whether the figure covers households only or includes other small uses connected to the mains. This distinction may seem technical, but it changes what the result means. For a household assessment, the property’s meter reading and the number of occupants provide a reference point that is closer to the household’s actual use.
How much water does each person use in France?
Figures commonly cited put drinking water use in France at around 150 litres per person per day. However, published values may differ by a few litres depending on the period and definition used. A national average summarises the overall picture; it does not predict the consumption of a particular home.
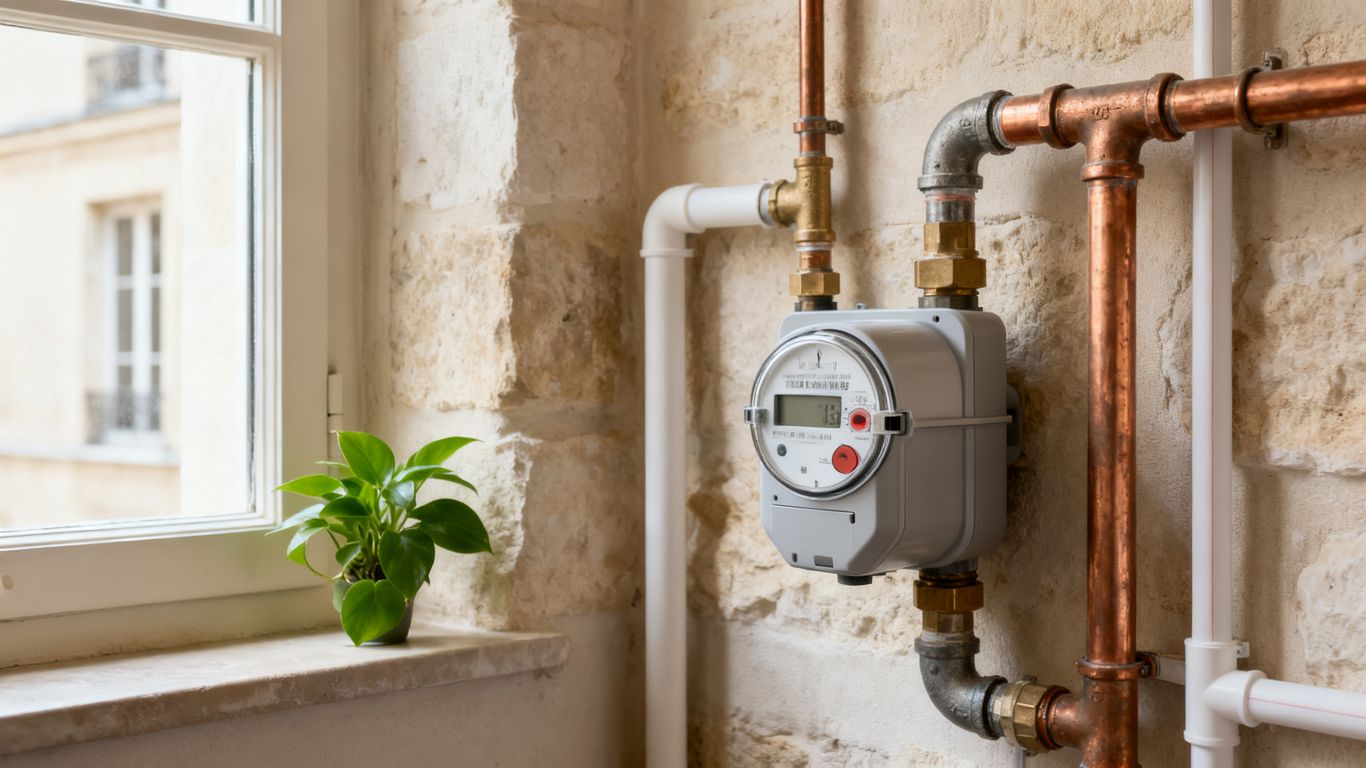
Daily and annual consumption figures
Based on the reference figure of 150 litres per day, the annual total is around 55 m³ per person, depending on how it is rounded. This figure covers drinking water supplied and associated household uses, not all the water needed to consume goods. For a more detailed look at habits and trends, see the consumption figures for France.
A calculator can also provide an indicative estimate based on the number of occupants and certain uses. It does not replace a meter reading: its results depend on the information entered and the assumptions used. It is most useful for identifying which areas to pay attention to.
Differences between regions and types of home
The national average conceals local differences. Climate and outdoor use, particularly watering, can have a greater impact in certain regions or at certain times of year. The characteristics of the home also matter: a house with a garden does not have the same usage profile as a flat with no outdoor space.
Household size affects total consumption, but not always in direct proportion per person. Several occupants share some appliances, while individual habits still differ. Local data can therefore be useful, provided you check that it measures the same uses as the national average.
Sources and methods used to calculate averages
Averages are calculated using volumes supplied, population data and statistical conventions. Depending on the source, the period covered, the scope of subscribers and the way small non-residential uses are treated may vary. A page providing an indicative calculation of water use can supplement these figures, but it is no substitute for an actual meter reading.
Critical reading of sources is also important for subjects that have a different scope: a page about choosing a duvet, privacy at Travel FX, brain fog or CIPD qualifications does not provide data on household water use. A guide to adding minerals to water, on the other hand, covers a related topic, but one that is distinct from the volume consumed.
How does water consumption vary between countries?
Comparing countries can shed light on differences in lifestyles and resource management, but published figures are not always based on a common definition. Some cover water supplied to households, while others relate to abstraction or broader uses. A useful comparison therefore starts with choosing a consistent indicator, rather than compiling a quick ranking.
Comparing national averages using consistent data
To compare national averages, you need to align the unit, period and scope. The table below shows why two figures expressed in litres per day may still describe different things.
| Indicator | What it describes | What to check |
|---|---|---|
| Household water supplied | Use of drinking water at home | Whether small non-residential uses are included |
| Abstraction per capita | Water taken from the environment for several sectors | The share used by agriculture, industry or energy |
| Water footprint | Water used directly and throughout production chains | Calculation method and goods included |
A difference between two countries may therefore be due as much to their calculation methods as to residents’ habits. A robust comparison states the source, year and definition used, and avoids presenting figures with different scopes as though they were equivalent.
The role of climate, resources and access to water
Climate can affect the need for water for watering, outdoor cleaning or certain heat-related uses. Local resource availability and seasonal restrictions also influence behaviour. These factors do not all work in the same way: they may affect the volumes abstracted without having the same effect on household consumption measured by the meter.
Access to water matters too. Where supplies are intermittent or less accessible, the volumes recorded do not necessarily reflect a preference for lower consumption. They may instead point to restrictions on access. You should therefore avoid treating a low figure as proof of greater water efficiency without knowing the context.
The effect of living standards and household equipment
Available equipment and levels of comfort influence how water can be used: whether there is a shower, washing machine or garden, as well as the efficiency of appliances and plumbing. Habits also vary, from how often laundry is done to the length of showers. No single factor is enough to explain a national average.
To better understand a difference between countries, it is useful to distinguish between equipment, behaviour and material conditions of access. This avoids automatically attributing differences to a single cause. It also serves as a reminder that averages describe populations, not individuals.
What is household water used for?
At home, drinking water is used mainly for hygiene and cleaning, while the proportion used directly for drinking and cooking is lower. The precise breakdown depends on habits, equipment and the season. Looking at the main areas of use helps explain what lies behind an overall average.
Showers and baths: duration, frequency and equipment
The length and frequency of showers can have a significant effect on the volume of water used. A bath generally uses more water than a short shower, but the comparison depends on the shower’s flow rate and how full the bath is. A water-efficient fitting can reduce flow without changing the basic use, provided it is suitable for the home.
It is therefore more useful to measure or estimate your own habits than to rely on a standard figure. A typical week is enough to give you an idea of how often you shower and bathe. This can help you identify a realistic change, without assuming that every household follows the same routine.
Toilets: the impact of flushes and leaks
Toilets account for regular water use because the flush is used several times a day. The type of flush, its setting and the condition of the mechanism all affect the volume consumed. A small leak, meanwhile, can allow water to run continuously and distort the impression given by normal use.
A simple check is to compare meter readings while all taps and water outlets are turned off. If the reading changes, it is worth investigating a leak. This check will not always locate the problem, but it can help distinguish occasional use from a continuous loss.
Laundry, washing-up and cooking: variable levels of consumption
Washing cycles and how fully appliances are loaded make these uses vary from one household to another. How often you do laundry, which programme you select and the size of the load all matter. In the kitchen, water is used for preparing and cleaning food, while drinking it directly accounts for a small proportion of total household use.
To build a personal picture, you could note the following recurring uses for a few days:
- the number of washing machine and dishwasher cycles;
- the programmes selected and how fully the appliances are loaded;
- rinsing and food preparation habits;
- differences in consumption between weekdays and weekends.
These observations can highlight habits that could be changed without requiring complex calculations. They are most useful when compared with the overall meter reading, which helps you check whether your estimates match the volume actually supplied.
Watering and other outdoor uses: seasonal differences
Watering the garden, washing a patio or filling an outdoor feature can increase consumption, especially during hot weather. These uses are more relevant to some homes than others and are not spread evenly throughout the year. An annual average can therefore conceal marked seasonal peaks.
Comparing readings from different times of year can help distinguish an increase linked to the garden from a change in indoor use. For outdoor water use, the weather, local restrictions and the plants’ actual needs are more useful guides than a single target for everyone.
Why do figures differ from one person to another?
Two people living in the same country can have very different levels of consumption, even if they have access to similar services. The number of occupants, the layout of the home and the appliances affect both total volume and the per-person calculation. Meter readings also have limitations that should be kept in mind.
Household size and shared appliances
Some uses are shared within a household: a load of laundry, for example, may be for several people, as may cleaning certain rooms. Other uses depend mainly on individual habits. That is why a household’s per-person consumption cannot always be calculated simply by dividing in proportion to the number of occupants.
Periods away from home, visitors or the presence of children can also temporarily affect the reading. Over a short period, these events have a greater impact on the result. An average over several months or a full year smooths out some of these variations.
Daily habits and choice of appliances
The length of showers, frequency of laundry and programmes selected all affect daily water use. Equipment matters too: an older toilet, tap or appliance may use more or less water than a newer model. The way it is used is just as important as its technical specifications.
To reduce water use without disrupting household life, it is best to start with one obvious area and choose a measure everyone can maintain. You can then check the result using comparable readings, rather than relying on a general estimate.
Water loss, meters and the limitations of estimates
A meter measures water passing through the home’s supply, but it does not automatically show which use is responsible. A leak, outdoor watering or a change in household composition may explain an increase. Estimates based on average use are helpful, but they do not replace meter readings.
The reading period may also fail to match typical habits exactly. For a fairer comparison, note the dates, number of occupants and any unusual events. A one-off change does not necessarily indicate a lasting trend.
How should you interpret comparisons and reduce water use?
National and international figures are reference points, not uniform instructions. For a household, the most useful approach is to understand what is being counted, then identify which uses actually account for the meter reading. A gradual approach helps you choose suitable measures without confusing potential savings with going without.
Check the scope and year of the data
Before relying on a figure, check whether it is an average per person or per home, whether it covers household water and which year it relates to. The period matters because habits, equipment and local conditions change. Energy indicators require similar care: for example, a home’s electricity consumption cannot be compared directly with a volume of water.
Finally, the data should be relevant to the question being asked. An indicator of water abstraction does not answer the same question as the volume of drinking water shown on a bill. Keeping these distinctions in mind helps you interpret comparisons without reading more into them than they show.
Identify the biggest uses in your household
To identify the main areas of use, start by taking meter readings at regular intervals, then note any events that could explain a change. You do not need to track every action minute by minute: a short, well-chosen period of observation may be enough to reveal a leak or unusual outdoor use. The aim is to turn a general average into useful information about your home.
A simple approach could follow these steps:
- Take a meter reading on a set date and note the number of occupants.
- Observe the most frequent uses for a week.
- Check toilets, taps and appliances if consumption is unexpectedly high.
- Take a new reading after changing one use at a time.
This makes it easier for the household to link changes to a specific action. An estimation tool can provide additional information, but comparing readings taken under similar conditions is more practical.
Choose measures and equipment suited to your circumstances
The most useful measures address uses you have actually identified. Fixing a confirmed leak can prevent a continuous loss; shortening showers or adjusting a washing cycle may suit other households. There is no single measure that will produce the same result for everyone.
It is best to test one change at a time and then check its effect on the meter. This allows you to keep changes that work and discard those that are not suited to your home. For a home energy project, you can also get in touch with the team to find out about the services offered by Solencia.
In conclusion: what you can do
Per-person water consumption is a useful reference point, provided you do not confuse the national average with household use or water footprint. In France, the figure of around 150 litres per day offers an initial comparison, but household meter readings, equipment and circumstances give a more precise picture. Understanding these factors helps you reduce avoidable use by choosing measures suited to your actual situation.
Frequently asked questions
How many litres of water does one person use per day in France?
A commonly cited reference figure is around 150 litres of drinking water per person per day. The exact value depends on the year and statistical scope used.
How many cubic metres per year is 150 litres per day?
Over 365 days, 150 litres per day is around 54.8 m³, or nearly 55 m³ per year. This is an indicative conversion, not an individual measurement.
Do household water and water footprint mean the same thing?
No. Household water mainly covers uses at home, while water footprint also includes water used upstream to produce goods or food.
Why do averages vary between sources?
Sources may differ in the year, scope, method and populations covered. Some include uses that others exclude.
Which household uses account for the most water consumption?
Hygiene and cleaning generally account for the largest share of household use. The breakdown varies depending on equipment, habits and whether there is a garden.
How can I tell whether a leak is increasing my water consumption?
Read the meter, make sure all taps and water outlets are turned off, then check whether the reading changes. An increase may indicate a leak that needs further investigation.
How can I compare water consumption in two countries?
Check that the figures cover the same type of use, use the same unit and relate to comparable periods. A figure for water abstraction should not be treated as a measurement of household water use.

Thibault Mouillefarine est responsable éditorial de Solencia, une plateforme dédiée à la compréhension, à la qualification et à l’accélération des projets photovoltaïques professionnels. Fondateur de Millennium Digital, agence spécialisée en stratégie digitale B2B, il accompagne les entreprises dans la transformation de sujets complexes en parcours de décision clairs et orientés résultats. Les contenus publiés sur Solencia s’appuient sur des sources publiques et institutionnelles : textes réglementaires, documentation Enedis, données CRE, informations EDF OA, ressources ADEME et publications officielles liées à l’énergie.